Kyungdong Navien Stock Fell 11.3 Percent on Its Beat Day
I keep a rule that a strong quarter should show up in the price, and Kyungdong Navien stock made me put that rule down twice in one weekend. On August 12, 2026, the company said second quarter operating profit had risen 64.60 percent from a year earlier. The shares closed that session at KRW 68,300 against KRW 77,000 the prior session, a drop of 11.30 percent, on volume of 458,701 shares against 135,582 the day before.
A single bad session after a good print is ordinary. What made me put the rule down a second time is that the identical sequence had already happened one year earlier, and that time the sellers were the ones who read it correctly.
The five statements I am holding, and the document each one stands on
1. Second quarter operating profit was KRW 84.261 billion against KRW 51.191 billion a year earlier, up 64.60 percent.
Standing on the half-year report filed August 14, 2026 (receipt 20260814003740), with the first quarter cumulative figure subtracted out.
2. Revenue in that same quarter fell 1.04 percent, to KRW 388.199 billion from KRW 392.277 billion.
Same filing, same subtraction.
3. The first reason the company gave for the profit was a tariff refund, not selling more.
Korean press coverage dated August 12, 2026 quoting the company. My rendering of the Korean: steady results in North America and other global markets, plus the effect of a tariff refund.
4. One year earlier the market answered a beat with selling, and that answer held up.
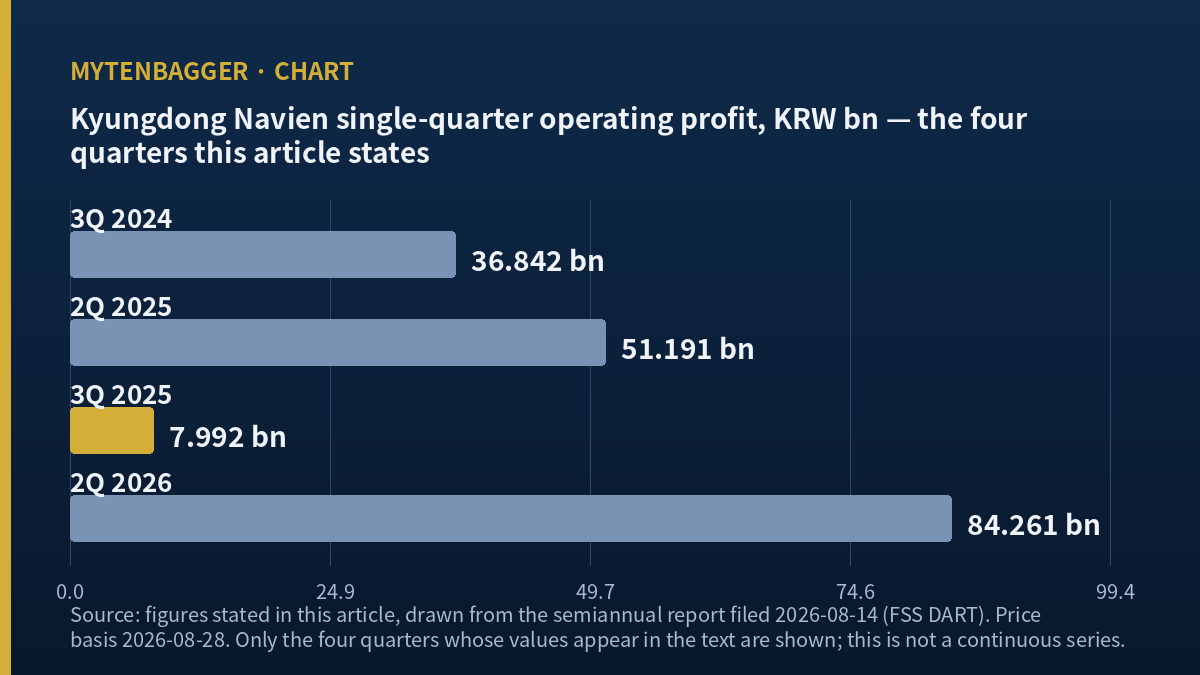
Korean coverage dated August 13, 2025 recording a 6.59 percent decline that session, plus third quarter 2025 operating profit of KRW 7.992 billion against KRW 36.842 billion a year before.
5. Nothing on file yet says which way the third quarter of 2026 went.
The statutory deadline is November 15, 2026, a Sunday, so the filing arrives on or after November 16.
My position first. I own none of this and I have no order working. The market value is KRW 922.2 billion, roughly USD 671.91 million at the rate I use below, which places it outside the hundred largest listings in Korea, so I watch and I do not size it.
Contents
What Kyungdong Navien stock did in the two sessions around August 12
Every price in this entry is the close of Friday, August 28, 2026. I am writing on Sunday, August 30, so the prior business day is the freshest print available. The close was KRW 63,300 on 14,568,720 shares outstanding, which multiplies out to KRW 922,199,976,000. That matches the market value on my data screen to the won.
The run into the print, and the gap out of it
From KRW 68,500 on August 4 the shares reached KRW 77,000 on August 11, a gain of 12.41 percent across five trading sessions. August 11 alone carried 7.24 percent of that, from KRW 71,800, with an intraday high of KRW 77,900. The earnings came the following morning.
August 12 opened at KRW 70,800, which is 8.05 percent below the prior close, traded down to KRW 65,900, and finished at KRW 68,300 for a decline of 11.30 percent. Volume of 458,701 shares was the largest in the eighteen sessions I pulled starting August 4, and 3.38 times the August 11 figure.
Nothing since has repaired it. The August 28 close of KRW 63,300 sits 17.79 percent below the August 11 close. The shares are at 76.08 percent of the KRW 83,200 high across 250 sessions and 19.43 percent above the KRW 53,000 low, and the twelve month change is a decline of 22.52 percent.
| Session | Close (KRW) | Volume (shares) | What happened |
|---|---|---|---|
| 2026-08-10 | 71,800 | 24,784 | Two sessions before the print |
| 2026-08-11 | 77,000 | 135,582 | Day before, up 7.24 percent |
| 2026-08-12 | 68,300 | 458,701 | Second quarter released, down 11.30 percent |
| 2026-08-14 | 68,100 | 68,182 | Half-year report filed |
| 2026-08-28 | 63,300 | 26,623 | The reference session for this entry |
The same tax moved Kyungdong Navien stock revenue one year and its profit the next
The company gave two explanations on August 12 and they point at the same policy from opposite sides. On the profit line, it cited steady performance in North America and other global markets together with the effect of a tariff refund. On the revenue line, it cited a base effect from the prior year, when sales had run high ahead of tariffs taking full force.
Read those together and the tax is standing on both sides of the comparison. In the second quarter of 2025 it inflated revenue, because customers pulled orders forward before the duty landed. In the second quarter of 2026 it inflated profit, because money paid under that duty came back. The direction reversed and the source did not.
Which line the refund landed on is something I could not settle
Kim Soo-hyun at DS Securities flagged this refund in advance. In a Korean report covered on May 28, 2026, the wording, in my rendering, is that refund procedures were under way for duties collected the prior year and would come back as non-operating income in the second quarter. The company then cited that refund when explaining the rise in operating profit, from KRW 51.191 billion to KRW 84.261 billion, a gain of 64.60 percent.
Either one of those two placements is wrong, or the money arrived split across both lines. I did not find a document that settles it, so I am recording the gap instead of choosing a side. One figure does not need the answer, though. Second quarter net income of KRW 68.456 billion against KRW 19.335 billion is a rise of 254.05 percent, close to four times the operating growth rate. Something below the operating line moved harder than the operating line did.
Why Kyungdong Navien stock needs subtraction before its quarters can be read
This is worth a paragraph for readers who work mostly with US filings, because it changes what you can take off a Korean screen at face value.
Korean interim reports carry flow items on a year-to-date basis. The second quarter filing shows six months of revenue and six months of operating profit, not three. To get a single quarter you subtract the prior cumulative figure. Six month revenue of KRW 813.519 billion less first quarter revenue of KRW 425.320 billion gives KRW 388.199 billion for the June quarter, and six month operating profit of KRW 148.071 billion less KRW 63.810 billion gives KRW 84.261 billion. Every single-quarter number in this entry was produced that way and I am flagging it because a reader who takes the cumulative line as a quarter will get growth rates that are wrong by a wide margin.
One consequence is worth keeping. Six month operating profit of KRW 148.071 billion is already 3.27 percent above the KRW 143.376 billion this company earned across all of 2025. Half a year has cleared a full prior year.
The 2025 rehearsal, and why the sellers turned out right
Korean coverage on August 13, 2025 described a scene with the same shape. Second quarter results came in well ahead of what the market carried, and the shares fell 6.59 percent against the prior close that session. Two houses were quoted.
DS Investment Securities read the revenue growth as pull-forward demand ahead of reciprocal tariffs taking effect. Shinhan Investment raised its valuation from KRW 120,000 to KRW 130,000 and still wrote, in my rendering, that earnings volatility risk remained depending on how reciprocal tariffs were finally applied and on inventory at the North American subsidiary. The same note said a conservative stance was appropriate for the second half.
That conservative stance was correct. Third quarter 2025 operating profit for the single quarter was KRW 7.992 billion against KRW 36.842 billion a year earlier, a decline of 78.31 percent. The company itself, on a preliminary basis, put the drop at 78.3 percent, and my subtraction lands on the same first decimal.
The reason is on the record too. Korean coverage dated January 30, 2026 quotes the company saying, in my rendering, that under the influence of US reciprocal tariffs customer pre-orders concentrated into the second quarter. The United States began applying a 15 percent duty to Korean-made boilers and water heaters in August 2025. What the second quarter borrowed, the third quarter did not have.
Five arguments against Kyungdong Navien stock right now
A page with only one side is a page short on research, so I put the other side early.
One, the sell-side range has swung hard
Shinhan Investment carried KRW 130,000 in August 2025, KRW 89,000 by November 2025, KRW 89,000 as of May 21, 2026, and KRW 110,000 on August 12, 2026. The current figure is KRW 20,000 below where the same house stood a year ago. A cut of 31.5 percent followed by a raise of 23.6 percent inside twelve months is itself a statement about how hard this business is to model.
Two, revenue went the other way
The margin expanded in a quarter when revenue slipped 1.04 percent. That is consistent with the company saying the profit did not come from selling more, and consistency is not the same as comfort. The second quarter operating margin of 21.71 percent sits 8.66 points above the 13.05 percent of a year earlier, and I do not know how much of that gap repeats.
Three, the forward columns are empty
Forward earnings per share, forward multiple and peer multiple are all blank on my data screen. I confirmed two named Korean houses, and both landed on the identical KRW 110,000, which means I cannot see dispersion. I also could not assemble enough public detail to compare a 2026 estimate against a 2027 estimate. That is a coverage gap and I am naming it as one.
Four, four years of spending more cash than the business made
From 2022 through 2025, cash from operations totaled KRW 330.403 billion and capital spending totaled KRW 360.418 billion. The four years together come up KRW 30.015 billion short, and the capital spending equals 81.61 percent of the KRW 441.632 billion of operating profit earned over the same stretch. The first half of 2026 flipped it, with KRW 122.091 billion of operating cash flow against KRW 62.448 billion of capital spending, leaving KRW 59.643 billion. One half-year is not yet a change of direction.
Five, the same setup already resolved against the buyers once
This is the one I weigh most, and it is the section above.
What the screen says about Kyungdong Navien stock belongs to last year
My indicator screen shows revenue of KRW 1,502.2 billion, operating profit of KRW 143.4 billion and net income of KRW 89.7 billion, and labels the period as trailing. Those three values match the audited full-year 2025 figures of KRW 1,502.239 billion, KRW 143.376 billion and KRW 89.698 billion. The label says one thing and the contents are another.
Add the four most recent single quarters, from the third quarter of 2025 through the second quarter of 2026, and the picture changes.
| Item | On screen | Four quarters added | Gap |
|---|---|---|---|
| Revenue | KRW 1,502.2bn | KRW 1,558.3bn | Added total is 3.73 percent larger |
| Operating profit | KRW 143.4bn | KRW 200.8bn | Added total is 40.06 percent larger |
| Net income | KRW 89.7bn | KRW 159.1bn | Added total is 77.37 percent larger |
| Operating margin | 9.55 percent | 12.89 percent | 3.34 points apart |
| Price to earnings | 10.28 times | 5.80 times | Screen is 1.77 times higher |
Net income of KRW 159.118 billion over 14,568,720 shares works out to KRW 10,921.9 per share, and the KRW 63,300 close divided by that gives 5.80 times. Both are my own back-calculations. The point is not that the shares are cheap. The point is that a reader who calls the screen multiple expensive is reading a year that already closed.
The same screen runs a seven-item checklist and gives this company all seven, a full score. Those seven boxes are reading the same closed year. A full score and a twelve month decline of 22.52 percent sitting on one page is not a contradiction, because the two are looking at different periods. The book value field behaves the same way. Book value per share of KRW 52,932 times the share count gives KRW 771.151 billion, within 0.085 percent of the KRW 770.495 billion of owner equity at the end of 2025. Recount on the KRW 887.982 billion of owner equity at the end of June 2026 and the price to book falls from 1.2 times to 1.039 times.
A.O. Smith, and why neither multiple is usable
The natural comparison is A.O. Smith (NYSE: AOS), which sells water heaters into the same North American houses. This is not a peer I picked for convenience. It is the peer Shinhan Investment reached for when it told clients to be careful about the second half of 2025, citing pricing pressure from A.O. Smith.
A.O. Smith closed August 28, 2026 at USD 60.38 with a market value of USD 8.21 billion. Multiplying the USD 60.38 close by 135.91 million shares gives USD 8.206 billion, which reconciles. Trailing twelve month revenue is USD 3.80 billion, trailing net income USD 500.30 million, trailing earnings per share USD 3.59, the trailing multiple 16.82 times and the forward multiple 15.48 times.
Against my recomputed 5.80 times for the Korean company, the gap is 2.9 times. I am not calling that a discount. Both companies are hard to value on a trailing multiple and the reasons run opposite. A.O. Smith has twelve months of steady earnings, so the multiple means something. Kyungdong Navien has, inside the same twelve months, one quarter where operating profit fell to KRW 7.992 billion from KRW 36.842 billion and another where it rose to KRW 84.261 billion from KRW 51.191 billion. The comparison worth making is not which multiple is lower. It is that one of these two companies currently has a multiple you can use and the other does not.
Where I stand on Kyungdong Navien stock and what would break my reading
No position, no order, watching. I do not think this company walked into the same trap twice. The 2025 pull-forward and the 2026 refund are different accounting events. What they share is that neither one carries into the following quarter on its own, and the market priced that shared property both times before it priced anything else.
I will also say where my expectation sits, because leaving it out would be dishonest. Half-year operating profit of KRW 148.071 billion has cleared all of 2025 by 3.27 percent, and it did so while revenue grew 7.40 percent and operating profit grew 63.36 percent. If the reduction in the universal tariff rate from 15 percent toward 10 percent that Shinhan Investment analyst Heo Sung-kyu described in May 2026 holds, and if the push into higher efficiency heating and cooling equipment does what management says it will do to the seasonality of this business, then I think normal earnings here sit above where the market is counting them. That is an expectation and it is not yet evidence.
Four conditions that would tell me I read this wrong
One. Third quarter 2026 single-quarter operating profit below KRW 37.018 billion. That figure is half of the KRW 74.036 billion average of the two first-half quarters, itself derived from the KRW 148.071 billion half-year total.
Two. The third quarter report describing the tariff refund as non-recurring in explicit terms. That would make the 21.71 percent second quarter margin a single reading and not a baseline.
Three. A third named house publishing a 2026 estimate below KRW 100,000. Two houses on the identical KRW 110,000 tells me nothing about dispersion.
Four. Operating cash flow turning negative again over the second half. Cumulative operating cash flow through the third quarter was negative KRW 47.119 billion in 2024 and negative KRW 26.023 billion in 2025. The third quarter is structurally a cash-out quarter for this company, so whether the 2026 cumulative figure stays positive is the test of whether the first-half improvement is real.
The check date is on or after November 16, 2026.
The axes I dropped, and why
Instead of a closing summary I will list what I decided not to build this entry around. What I left out is part of the record too.
Capital spending exceeding operating profit. The 2025 capital spending figure of KRW 153.510 billion is larger than that year’s operating profit of KRW 143.376 billion. Good material, but I published an entry built on exactly that structure on August 18, 2026 for a different company. Running the same frame twice makes the two entries compete with each other.
The full score on the seven-item checklist. Also used on August 18, on a different name. So here the full score got one paragraph explaining why it and the price decline share a page, and it did not become the spine.
The negative KRW 30.015 billion of cumulative free cash flow across four years. It survived as the fourth argument on the other side, but not as the spine. Two other entries published in August 2026 were built on cumulative cash burn.
Half-year capital spending measured against last year’s full-year figure. The KRW 62.448 billion first half is 40.68 percent of the KRW 153.510 billion full year 2025. Clean ratio, and that comparison form was already used in an August 2026 entry as well.
What survived those four is the entry you just read. Two years running, a good quarter landed and the price went down the same day, and one of those two times the price was right. The second answer arrives in November, and until then I am watching the sign on cumulative operating cash flow before I do anything else with this name.
Sources
- Newspim, second quarter operating profit of KRW 84.2 billion, up 64.6 percent, August 12, 2026 (Korean)
- Smart Today, shares fall despite an earnings surprise, August 13, 2025 (Korean)
- Newdaily, tariff impact and the high efficiency product response, January 30, 2026 (Korean)
- Financial News, lighter tariff burden and the HVAC push, May 24, 2026 (Korean)
- Newspim report brief, Shinhan Investment note on this company, August 12, 2026 (Korean)
- Company shareholder page, shares outstanding and treasury shares, year-end 2025
- Businesskorea market close report, KOSPI close and the won rate, August 28, 2026
- stockanalysis.com, A.O. Smith metrics as of the August 28, 2026 close
- Electronic Times, the Comax acquisition, December 17, 2025 (Korean)
Related entries where I ran the same kind of arithmetic. On what a fixed sum of money buys as a stake moves, see the Coway entry on what the payment is actually for. On a company whose margin ranking and valuation ranking disagree, see the SL Corp entry. On per-share profit halving while company profit held flat, see the Hanon Systems entry.
Basis note. Prices, market value and volume are Kiwoom data as of the Friday, August 28, 2026 close. Financial figures come from Korean regulatory filings, and every second quarter 2026 number here is a single quarter derived by subtracting the first quarter cumulative figure from the half-year report filed August 14, 2026 (receipt 20260814003740). The four-quarter totals and the per-share and multiple figures built on them are my own back-calculations. Currency conversion uses the August 28, 2026 Seoul market daytime session close of KRW 1,372.5 to one US dollar. On that same date one data provider showed a close 4.8 won higher and one Korean brokerage published a base rate 7.0 won higher. Those three are measuring different session cutoffs, so I have not called any of them an error, and this entry uses the daytime session close throughout. One item I could not reconcile: the company shareholder page lists 14,568,592 shares outstanding at year-end 2025 with 115,660 treasury shares, while my data screen carries 14,568,720. The 128 share gap does not move any figure here by a meaningful amount, and the market value above uses the screen figure.